How to Analyze Reports and Identify Profitable Segments
The Statistics page is your primary tool for evaluating campaign performance. By effectively using filters and grouping options, you can quickly identify your most profitable traffic segments and pinpoint areas where your budget may be underperforming.
How to Analyze Your Data
Follow these steps to generate and interpret your performance reports:
- Navigate to the Statistics (Reports) section of your dashboard.
- Choose a Sort by (Grouping) mode to organize your data. Common options include:
- Campaign: Overall performance per campaign.
- Day: Performance trends over time.
- Country / OS / Browser: Granular targeting performance.
- Source / Spot: Individual traffic source and placement IDs.
- Creative: Comparison of different ad assets (images/titles).

- Apply relevant Filters to narrow your analysis:
- Campaigns: Select specific campaigns to compare.
- Date Range: Choose the period for analysis.
- GEO / OS / Platform: Filter by specific technical characteristics.
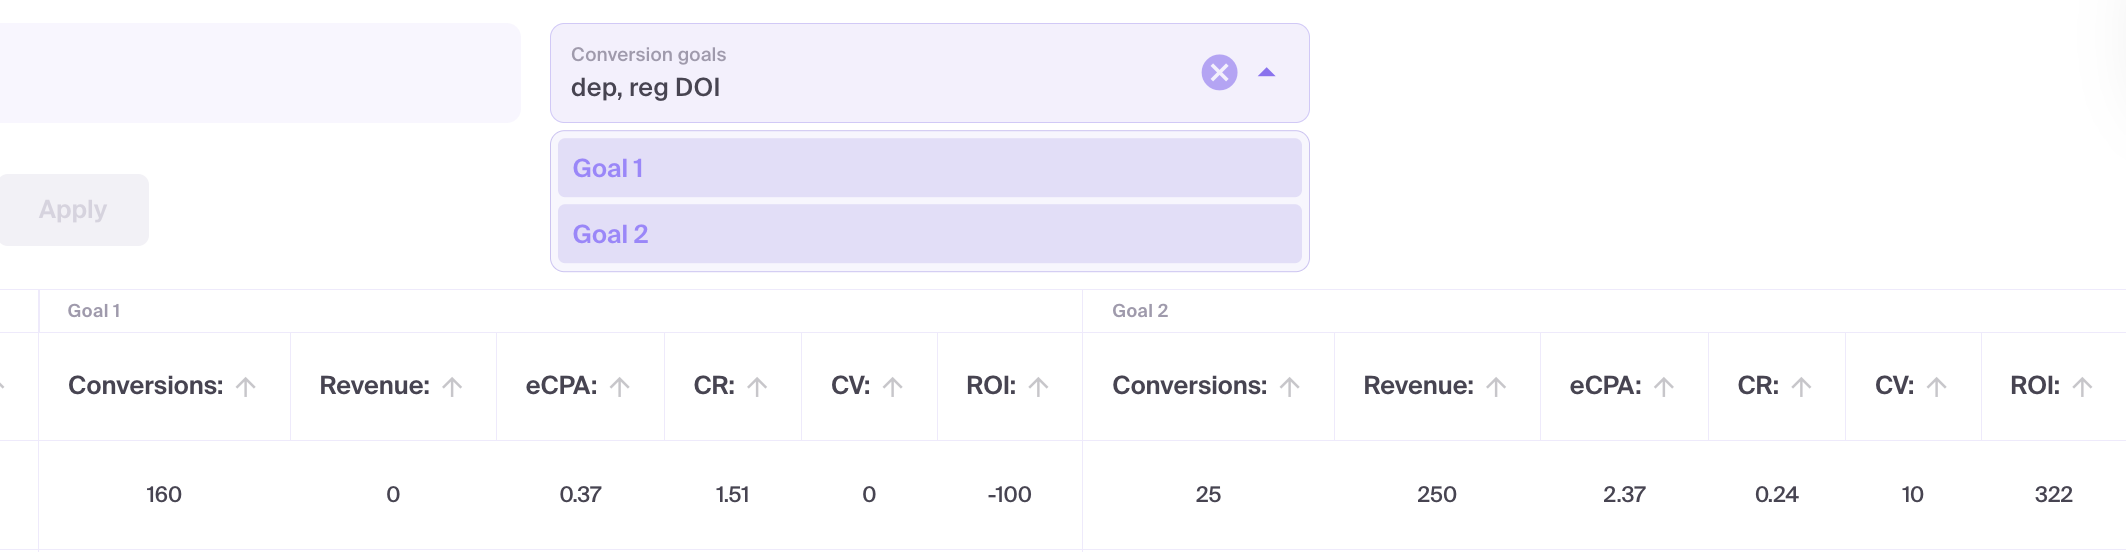
- Conversion Goals: Select the specific actions you want to track in the report.
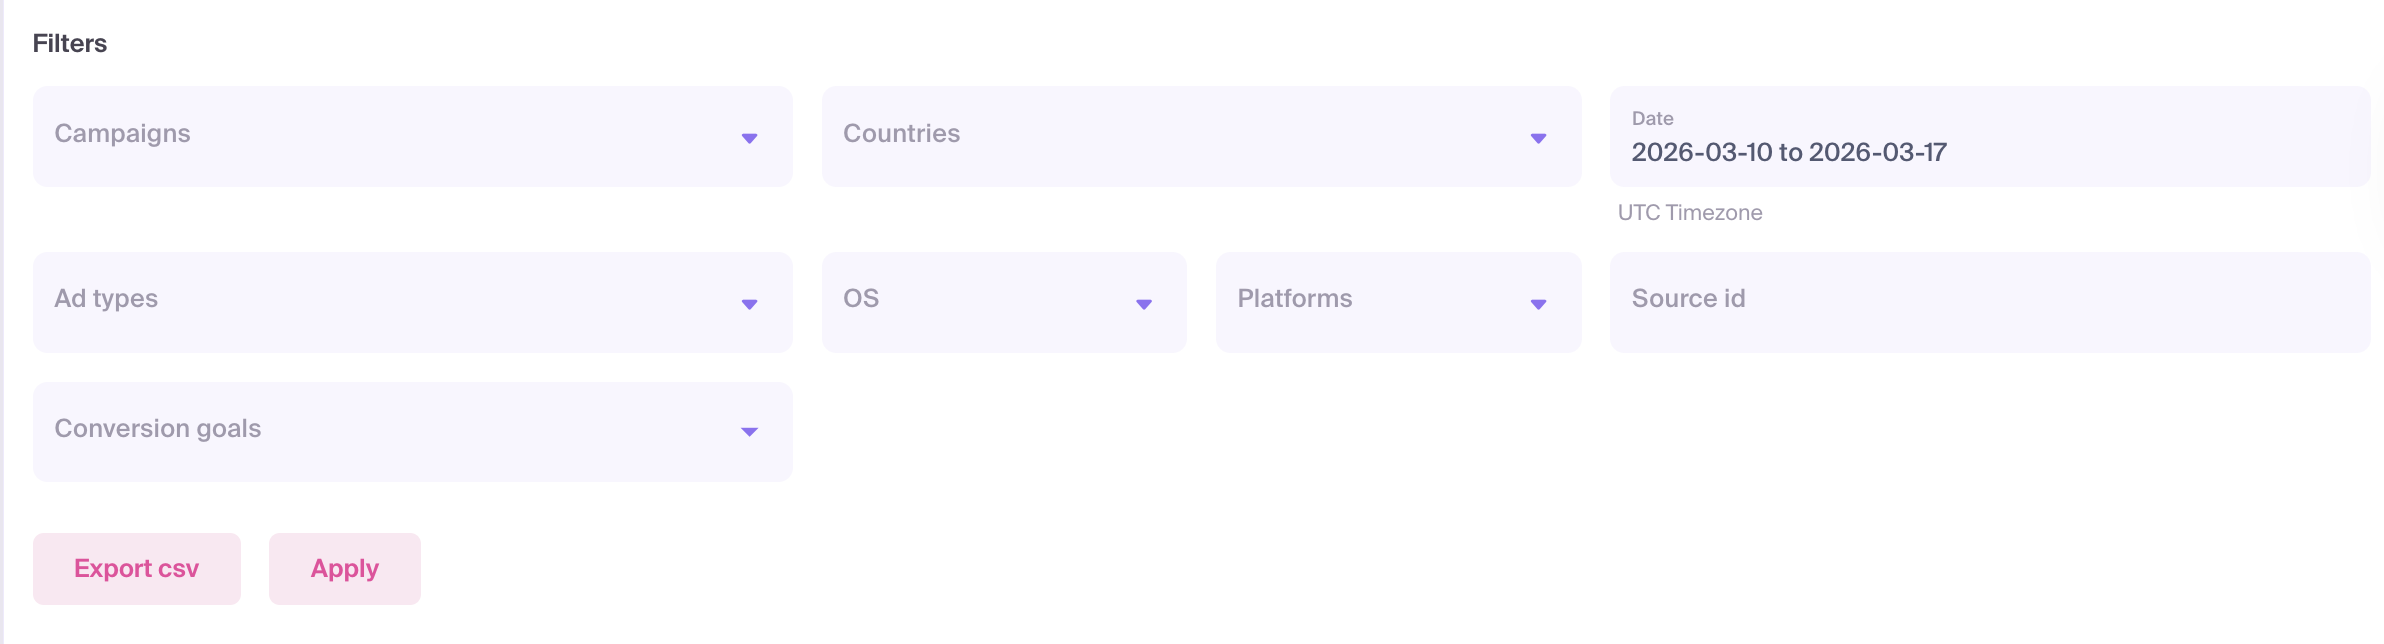
Click Apply to generate the table.
Review the Core Performance Columns:
- Impressions & Clicks: Overall traffic volume and engagement.
- CTR (Click-Through Rate): The percentage of users who clicked your ad.
- CR (Conversion Rate): The percentage of clicks that resulted in a conversion.
- Revenue & Spent: Your total earnings versus your advertising costs.
- eCPA (Effective Cost Per Action): Your average cost per conversion.
- ROI (Return on Investment): The overall profitability of the segment.
Conversion Goal Granularity: If you use Multigoals, use the Conversion Goals filter to see dedicated columns for each action.
Identify Winners & Losers:
- Winners: Keep and scale segments with a positive ROI and stable conversion counts.
- Optimization Required: Review segments with high spend but low ROI or high eCPA. Consider blocking these sources or adjusting bids.
Blocked Sources: If you are in Source group and have selected campaigns, click Blocked sources.

- Analyze the Blocking Icons:
- Manual Block: The source was blocked by you directly in the campaign settings.
- Optimizer Block: The source was automatically blocked based on your Optimizer rules.
![]()
- Data Export: Click Export CSV to download the current report for offline analysis or to share with your team.
Common Analysis Mistakes
- Insufficient Data: Making optimization decisions based on a very short date range or a few clicks. Ensure you have enough volume to be statistically significant.
- Vanity Metrics: Focusing only on high CTR while ignoring a negative ROI. Clicks are only valuable if they convert.
- Missing Filters: Forgetting to filter by specific GEOs or Conversion Goals when exporting data, leading to misleading aggregate results.
Troubleshooting
- Empty Report: If no data is shown, ensure your date range is correct, your selected campaigns are active, and your filters aren't too restrictive.
- Blocked Sources Button is Grayed Out: This button only becomes active when you group the report by Source and select at least one campaign from the filters.
- Export Discrepancies: If your CSV looks different than the dashboard, re-apply your filters and ensure the group selection matches your expected output.