Traffic Chart: How to Find Launchable Segments
The Traffic Chart is a powerful tool designed to help you estimate available traffic volumes and competitive bid levels before you launch a campaign. By analyzing these data points, you can identify the most promising segments and set realistic expectations for your advertising outcomes.
How to Use the Traffic Chart
Follow these steps to analyze potential traffic segments:
- Navigate to the Traffic Chart section in your dashboard.
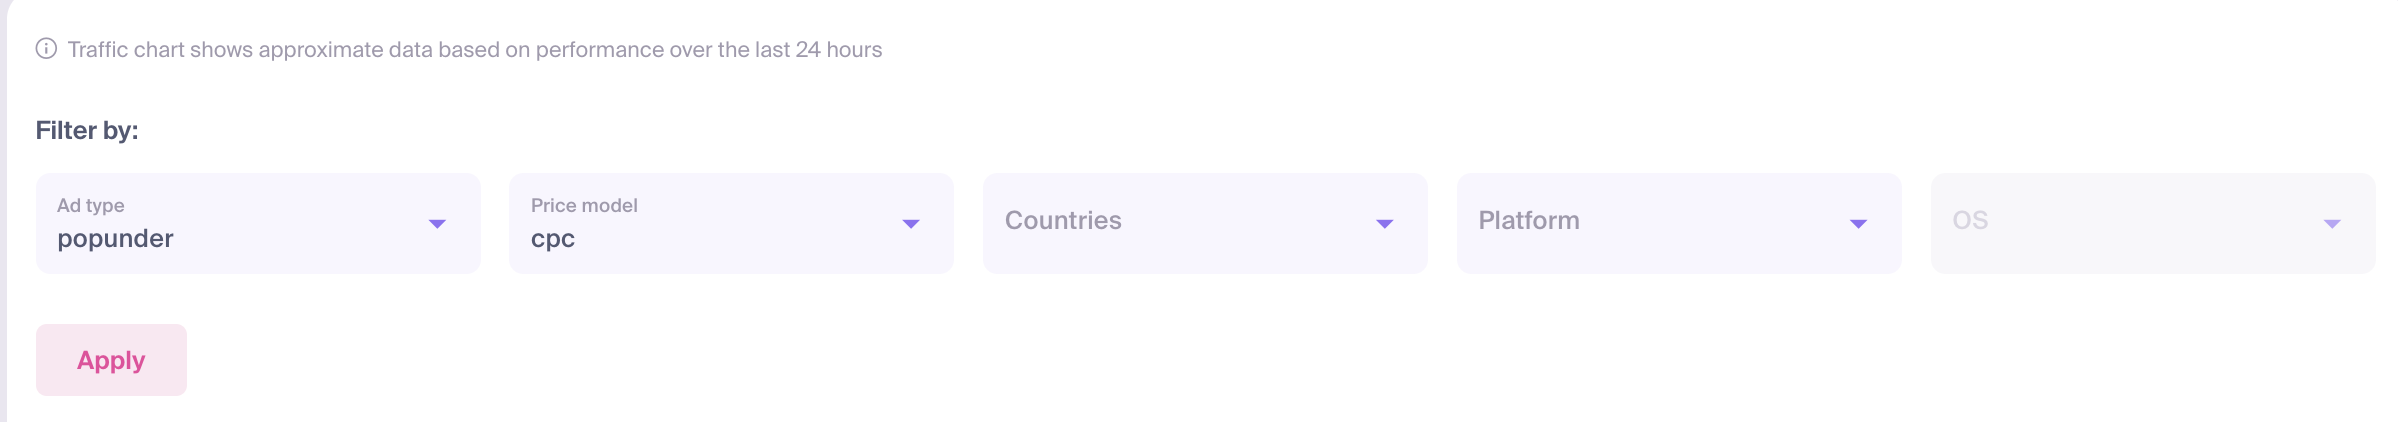
Configure your analysis filters:
- Ad Type: Select the format you plan to use (e.g., Push, In-Page, Pop).
- Price Model: Choose between CPC or CPM.
- Countries: Select the GEOs you are interested in.
- Platform & OS: Define the target devices and operating systems.
Click the Apply button to generate the report.
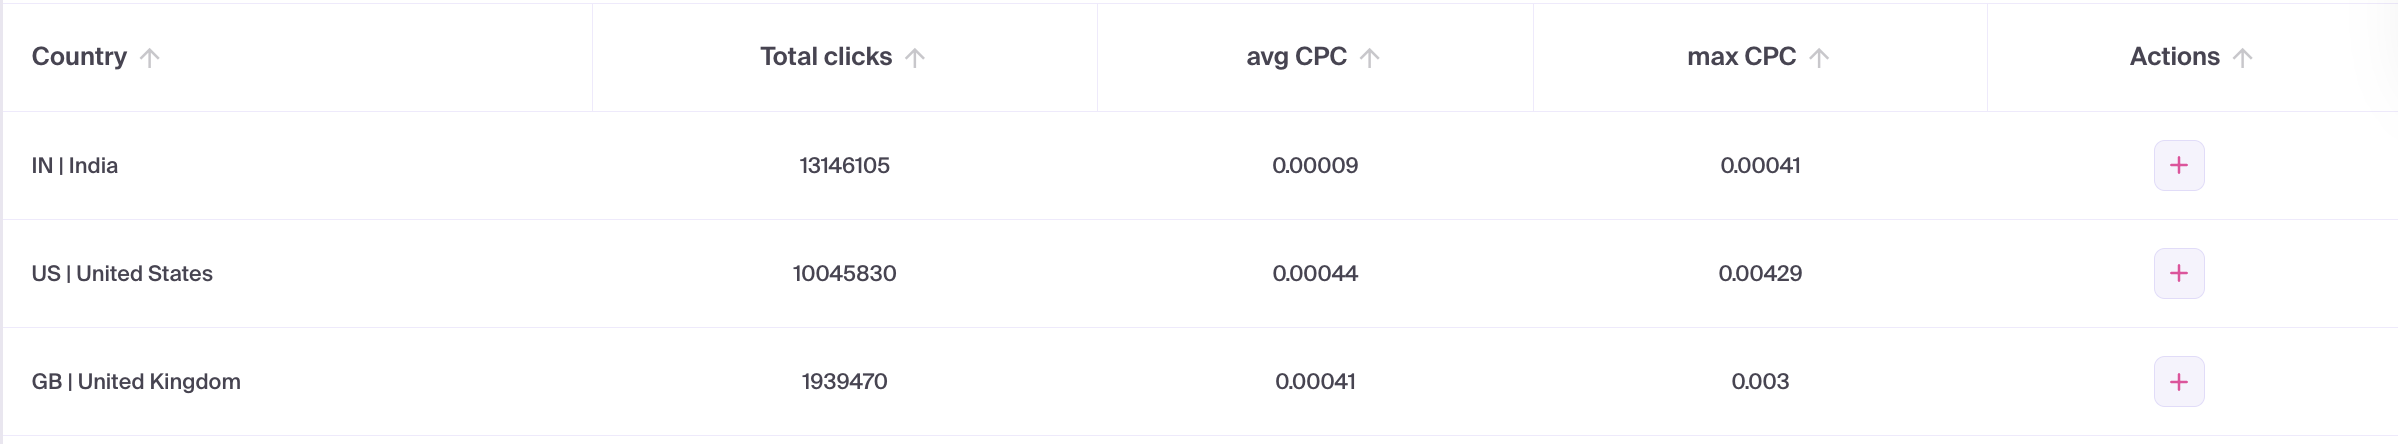
Analyze the results in the table:
- Available Clicks/Impressions: View the estimated total volume for the segment.
- Avg Bid: See the median bid currently winning traffic in this segment.
- Max Bid: Identify the highest competitive bid for top-tier placement.
Identify segments that offer a healthy balance of high volume and an acceptable bid level for your offer's ROI.
Once you find a profitable-looking segment, click the + (Plus) icon in the Actions column to immediately begin creating a campaign with those pre-filled targeting settings.
Common Analysis Mistakes
- Overly Narrow Filters: Applying too many filters simultaneously (e.g., a specific OS version, browser, and small GEO) may show zero or very low volume. Start broad to find the segments with the most potential.
- Pricing Model Mismatch: Ensure the price model you analyze in the chart matches the one you intend to use in your campaign, as CPC and CPM benchmarks vary significantly.
- Ignoring Trends: Traffic volumes and bid levels fluctuate. Use the chart regularly to stay updated on current market conditions rather than relying on a single snapshot.
Troubleshooting
- Low Volume Reported: If your desired segment shows low volume, try broadening your GEO or OS filters, or consider testing a different ad type.
- Bids Exceed Budget: If the average bids are higher than your payout allows, try tighter targeting on higher-converting segments or look for alternative GEOs with lower competition.
- Post-Launch Discrepancy: If your actual campaign volume differs from the chart, double-check that your campaign bid is competitive and that your targeting settings exactly match your analysis.